Loved by scientists from...


"Tabulous is the most delightful product I've used in science or biology."

What makes Tabulous different?
Most LIMS just track experiments.
Tabulous helps you analyze them.
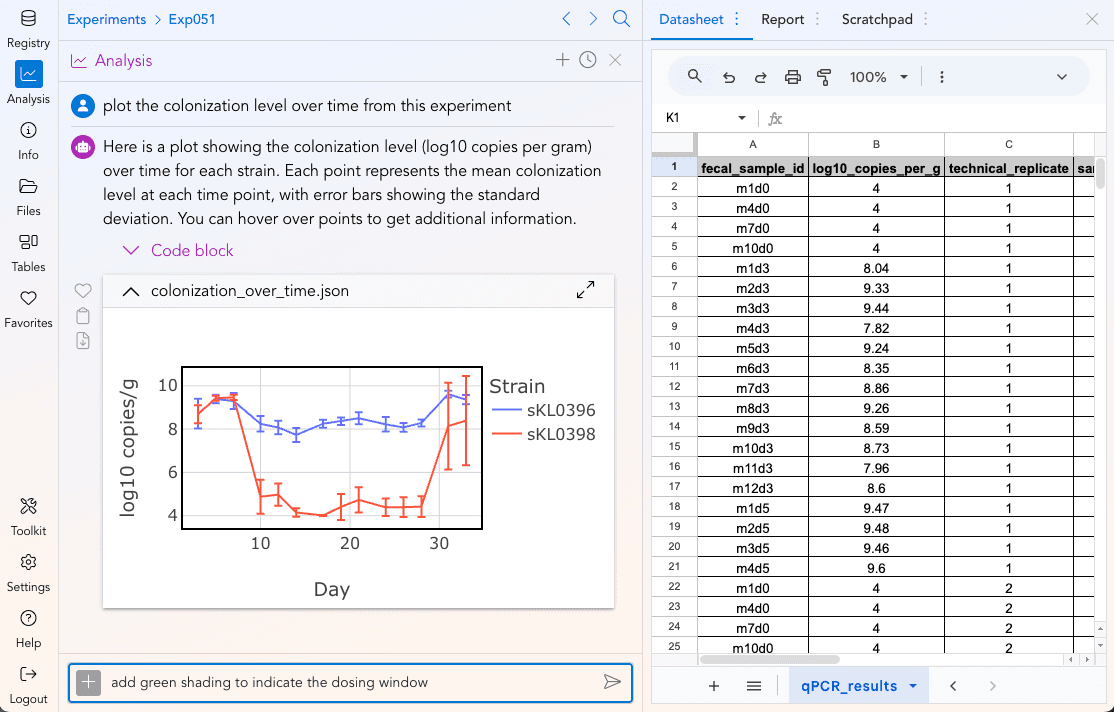
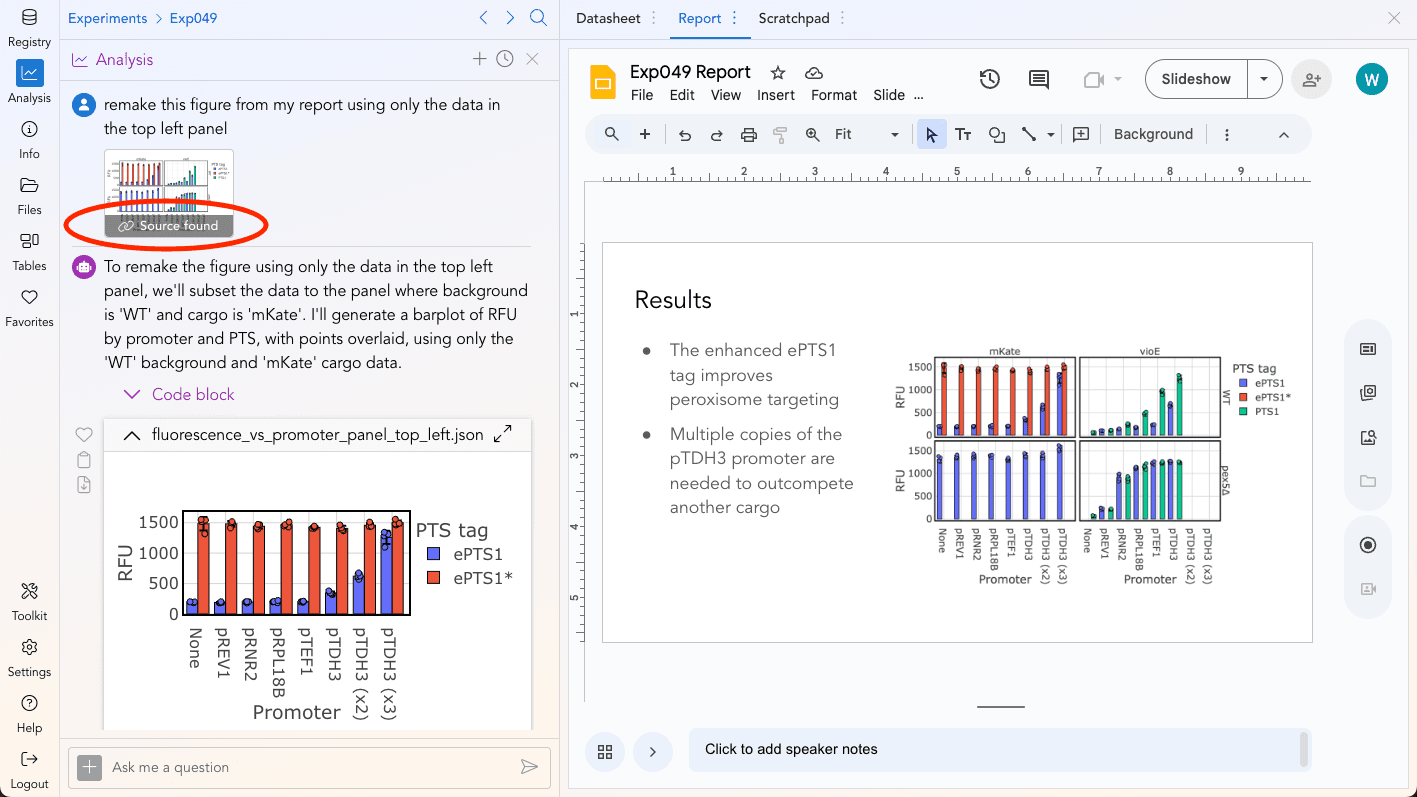
"Tabulous makes every scientist on the team a data scientist."Run statistics, generate plots, and perform analysis right from your LIMS.

Your team's long-term memory
You mentioned some promising research to your board.But now they want more details for the meeting later today.Meanwhile the scientist who did the work is on vacation and you have no idea where they put the data and code for their plot.

Ready to accelerate your research?
Schedule a call with a Tabulous scientist
Experiment tracking that sticks
Rigid LIMS slow down research. So researchers "defect" and keep their experiment data elsewhere.Tabulous is different: Built so scientists want to use it, not work around it.
Deploy in days, not months
Don't burn six months and two FTEs on your LIMS rollout.Our founder-led onboarding approach makes it possible.
Tabulous Deployment Timeline
Tabulous is much more than a LIMS
See how AI-powered analysis, team memory, and a flexible registry work together to transform biotech workflows.
Trusted by biotech leaders

"Tabulous has been an invaluable tool for Nanopath, enabling our leadership team to quickly access data across a range of research programs and effectively prioritize future work to meet key company milestones... Tabulous has allowed us to more efficiently advance technologies that address critical gaps in women's health diagnostics."


"The Tabulous platform is sophisticated, logical, and incredibly easy to use — it worked for us right out of the gate. After struggling with more labor-intensive systems that required endless back and forths with an implementation team, Tabulous was a breath of fresh air. Our team was fully up and running after a single one-hour onboarding call. The Tabulous team was knowledgeable, responsive, and supportive throughout, making the entire process seamless."

